|
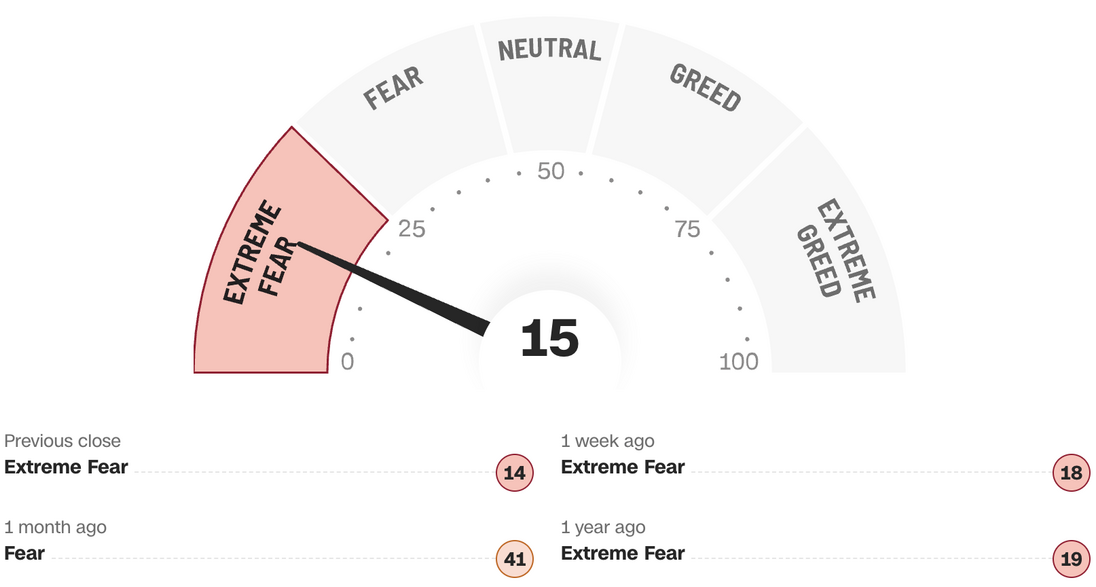
What is CNN Fear & Greed Index?CNN Fear & Greed Index tracks seven indicators of investor sentiment.
Investors are driven by two emotions: fear and greed. Too much fear can sink stocks well below where they should be. When investors get greedy, they can bid up stock prices way too far.
CNN Fear & Greed Index looks at 7 indicators:
|
How is the CNN Fear & Greed Index calculated?
For each indicator, CNN Fear & Greed Index looks at how far they've veered from their average relative to how far they normally veer. It looks at each on a scale from 0 - 100. The higher the reading, the greedier investors are being, and 50 is neutral. Then it puts all the indicators together - equally weighted - for a final index reading.
How is the CNN Fear & Greed Index used?
How the CNN Fear & Greed Index can guide investing? Too much fear can drive stock prices too low, while greed can raise prices too high. If used properly, the Index can be used as a guide for making profitable investments. It is suggested to watch for strong currents of fear, and when they hit, watch for companies that are undervalued. That way, you can uncover some otherwise hidden opportunities for great investment, provided you stay with the stock for the long haul.
- When the S&P 500 (SPX) plummeted to a three-year low on Sept. 17, 2008 - the height of the financial crisis -- the Fear and Greed index sank to 12.
- The index gained some ground to 28 before stocks finally bottomed out on March 9, 2009 and the latest bull market began.
- Most recently, in the first quarter of 2012, stocks staged their best run in decades, and the index showed pure greed.
Further Readings: The Modern Fear & Greed Index
As pointed out by Barry D Moore, the CNN Fear and Greed Index often gives an unclear picture of the fear and greed of traders and investors. He has created the Modern Fear & Greed Index to improve the CNN Fear & Greed Index. His main idea is to define 9 interactive stock charts and show real fear & greed using technical analysis and sentiment indicators.
Further Readings: The SPX Put/Call Ratio
The SPX Put-call ratio (PCR) is an indicator commonly used to determine the mood of the options market. Being a contrarian indicator, the ratio looks at options buildup, helps traders understand whether a recent fall or rise in the market is excessive and if the time has come to take a contrarian call. The ratio is calculated either on the basis of options trading volumes or on the basis of options contracts on a given day or period.
- A PCR below one (<1) suggests that investors are purchasing more call options than put options and signals that investors are speculating a bullish trend going forward.
- A PCR above one (>1) suggests that investors are purchasing more put options than call options and signals that investors are speculating a bearish trend going forward.
Further Readings: The Advance/Decline Line
The Advance/Decline line (A/D Line or ADL) measures the number of individual stocks participating in a market rise or fall. It tells a story of the cumulative sum of the daily difference between the number of stocks advancing and the number of stocks declining in a particular stock market index. It moves up when the index contains more advancing than declining issues and moves down when there are more declining than advancing issues. A/D Line = (# of Advancing Stocks - # of Declining Stocks) + Yesterday's A/D Line Value).
Divergence happens when the stock market index moves in one direction while the ADL on that index moves in the opposite direction. If the index moves up while the ADL moves down, the index may be misleading about the market direction. The history showed that it happened toward the end of the US Dot-com bubble in 1999-2000 when the NASDAQ Index continued to rally while the ADL diverged downward starting at the beginning of 1999. Such negative divergence happened again in March 2008 before the late-2008 market collapse. Here are Real-time ADL data for major markets.
|
|
|
|