
|
What is BB-Sigma Index?The BB-Sigma Index is a scientific indicator measuring the capital market sentiment, originally developed by ISIR in 1997. It is an indicator solely based on intra-day market trading actions to identify market trend changes. It can be used as a market psychology measure or as a long-term market cycle indicator.
The general understanding of the financial industry has been that return and risk are real and fundamental. Therefore we have been so used to and positive for any description of the capital market by Nobel Prize-winning economics works. That led us to believe that the modern portfolio theory and related academic research are true descriptions of the market.
If we have observed the stock market movements more in-depth and long enough, many of us have seen evidence that return and risk (standard deviation) are not fundamental. They are derived or emergent concepts. We all know what temperature means. It measures something as hot or cold. Scientific discoveries taught us that temperature is just an emergent idea and the fundamental idea is the motions of atoms.
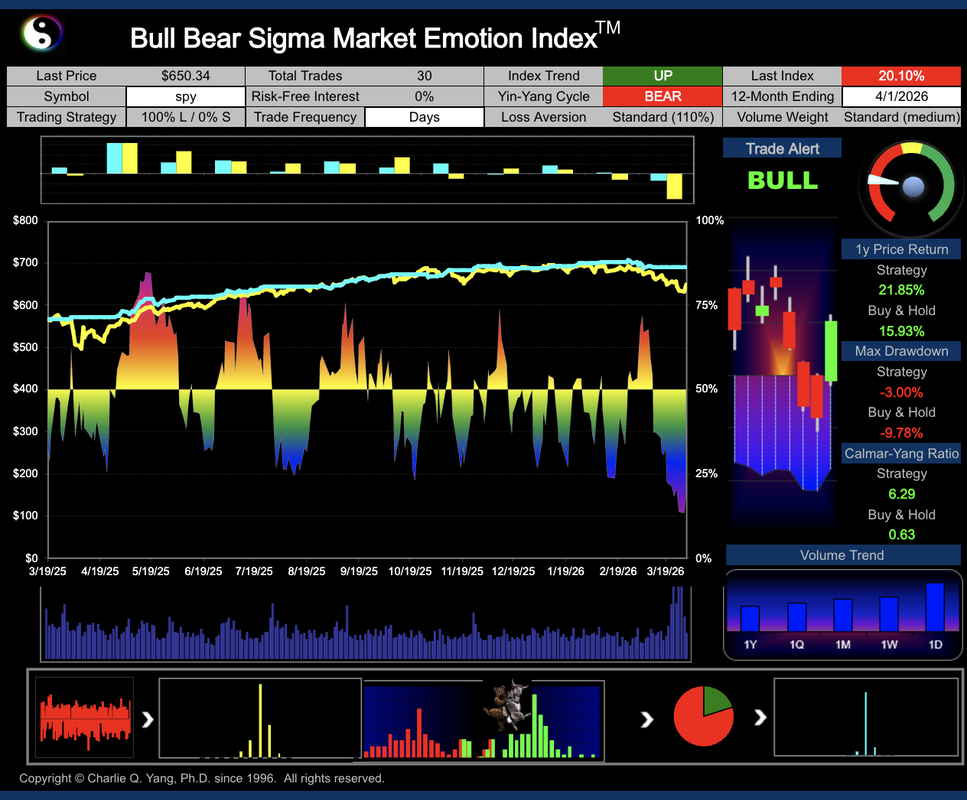
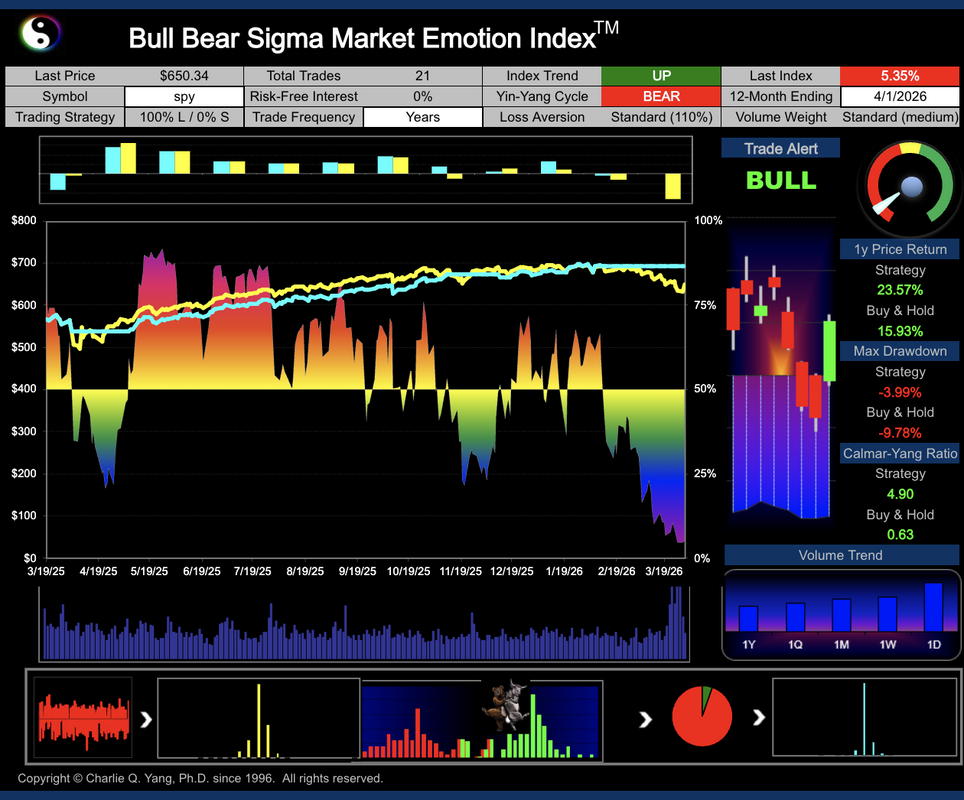
The following are the most recent BB-Sigma Index charts for S&P 500 short-term and long-term, respectively. It clearly shows how BB-Sigma Index can protect investment capital during market downturns and maintain most of up-market capture (12-month period shown).
Note: The blue line shows the S&P 500 investment value using SPY based on BB-Sigma Index trading signals. It has outperformed the yellow line (buy-and-hold) over the same 12-month period.
|
How is the BB-Sigma Index calculated?
For any publicly traded security with sufficient liquidity, the BB-Sigma Index is calculated by aggregating the trading actions taken by all bullish and bearish investors on a daily basis.
Step 1: The intra-day trading actions for a given stock (or ETF) are sampled by measuring up-ticks and down-ticks weighted with market order volumes;
Step 2: The resulting statistical samples over a defined period is captured as random noises, and then processed into single-mode price normal distribution, and dual-mode bull/bear distributions (Reference).
Step 3: Dual-mode distribution is then modeled by Q-Distributions with optimized Q calculated.
Step 4: The BB-Sigma Index is derived with additional steps of normalization and incorporates other parameters for complete presentation to create the final BB Sigma Index chart.
How is the BB-Sigma Index used?
The stock market trend behaves from quantitative change to qualitative change all the time. This is because the unpredictable nature of future significant forces (various events such as political policy change) which can trigger the transition of such changes. The stock market trend can be predicted during quantitative phase and detected when transition to qualitative phase is triggered. The process of quantitative change is defined as when the economical cycles are gradually improving (bull) or deteriorating (bear) without significant (material) new forces (events).
According to Dr. Charlie Q. Yang's Capital Market Behavior Theory (CMPT), the stock market trend reversal happens where the overall bullish forces overtaking the overall bear forces in controlling the market direction, or vice versa. The feasibility and justification of such a detection or prediction power is based on the fact that except encountering sudden significant forces, the gradual movement of the stock market are phased by the money flows with various smart levels. The smarter money trades early and the general public money always trades the last.
Further Readings: US Stock Market Confidence Index (Yale ICF)
Confidence in the stock market is much harder to pin down than is consumer confidence. People interested in the stock market tend to view themselves as playing a game against other stock market investors, trying to guess when stocks will do well before others do, so that they can profit from this knowledge. The International Center for Finance (ICF) at Yale University provides a stock market confidence index for the United States.
- The index is based on four different investor confidence indices, each measured in percent, as percent of respondents who report holding a certain view. Forming a simple average of the different indices to produce one overall US stock market confidence index would be arbitrary. Instead, Yale ICF reports four different investor confidence indices. The index is calculated separately for institutional investors and individuals based on surveys conducted monthly since 2001.
- Yale ICF recognizes that investor confidence is only one of many forces on the market. Stock prices are of course determined by supply and demand, and there are numerous factors that affect these, fundamental factors, legal, tax-related, demographic, technological, international, as well as other psychological factors related to attention, regret, anchoring, and availability. Indexes of stock market confidence can only play a supportive role in trying to understand market events.
Further Readings: Investor Movement Index (IMX)
The Investor Movement Index, or the IMX, is a proprietary behavior-based index. TD Ameritrade (now Charles Schwab) designs the IMX to indicate the sentiment of individual investors. It measures what investors are doing and how they position their portfolios in the markets. Compared to the BB-Sigma Index, the IMX is not real-time and relies only on sampling the firm's limited number of clients.
- The IMX is a monthly index released in the first week of each month based on a prior month sample from retail investor clients who have traded recently. It calculates an individual score based on the holdings and positions in each portfolio. The median of the individual scores is the overall IMX.
- The IMX calculation uses data from holdings/positions, trading activity, and other information from a sample of >10 million funded client accounts.
- The overall IMX score treats each client account, large or small, equally.
Further Readings: Risk On Risk Off (RORO) Indicator
The Risk-On / Risk-Off Indicator (RORO) measures the current risk appetite or “mood” of the market.
- The Risk-On / Risk-Off Indicator is a compilation of several financial instruments commonly used to measure risk appetite in the market. The meter tracks current price changes relative to the previous day’s price. Price changes are caused by “risk on” or “risk off” flows and indicate how market participants adjust their positions in response to changing market conditions and their perception of risk.
- Different financial instruments are given different weights in calculating a score from 0 to 100, with “100” representing maximum “risk on” mood and” 0” signaling maximum “risk off” mood. Every component and the indicator are calculated in real-time whenever the markets are open.
- It can be used as a short-term indicator to support your decision-making process. Understanding whether the market is “risk on” or “risk off” allows you to align your actions to trade with, not against, the current risk sentiment.
- Different firms (e.g., Bloomberg, Goldman Sachs, and Alpha Financial) can develop proprietary RORO indicators with different methodologies and calculations. For example, you can measure the relative strength of several asset classes with a score ranging from -1 to +1, with positive scores indicating a risk-on sentiment and negative scores indicating a risk-off sentiment.
Further Readings: Cboe SKEW Index (aka "Black Swan" Index)
The crash of October 1987 sensitized investors to the potential for stock market crashes and forever changed their view of S&P 500® returns. Investors now realize that S&P 500 tail risk - the risk of outlier returns two or more standard deviations below the mean - is significantly greater than under a lognormal distribution.
- The Cboe SKEW Index is an index derived from the price of S&P 500 tail risk. Similar to VIX®, the price of S&P 500 tail risk is calculated from the prices of S&P 500 out-of-the-money options. SKEW typically ranges from 100 to 150. A SKEW value of 100 means that the perceived distribution of S&P 500 log-returns is normal, and the probability of outlier returns is therefore negligible.
- As SKEW rises above 100, the left tail of the S&P 500 distribution acquires more weight, and the probabilities of outlier returns become more significant. One can estimate these probabilities from the value of SKEW. Since an increase in perceived tail risk increases the relative demand for low strike puts, increases in SKEW also correspond to an overall steepening of the curve of implied volatilities, familiar to option traders as the "skew".
Further Readings: Qraft AI Risk Indicator
Developed by Qraft Technologies, the AI Risk Indicator is an artificial intelligence-based U.S. stock risk model designed to forecast risk in the equity market in the near term, for tactical portions of the investment portfolio.
The Qraft AI Risk Indicator uses a proprietary AI model developed by Qraft Technologies that predicts a week’s worth of market risk after utilizing machine learning to analyze key macro market indicators. The index is designed to serve as a compass for investors based on the risk in the market that is predicted by our AI model, displaying signals in three stages: Risk On (reduction in cash allocation & increase in equities allocation), neutral (no changes in asset allocation), and Risk Off (increase in cash allocation & decrease in equities allocation), that correspond to a recommendation of cash allocation levels.
Notice that the BB-Sigma Index was originally developed based on capturing the tail risks of any tradable securities using a new probability distribution named Q-Distribution. It is readily applicable to the overall US market index such as the S&P 500 when measuring its exchange-traded fund (SPY).
The BB-Sigma Index is also known as Yin-Yang Index. It can be viewed as a new technical indicator that is based on "intra-day" trading statistics instead of "inter-day" price movements. It can be used to detect the market trend and measure the stock market psychology for any securities traded on any stock exchanges. It has been proven that the more timely of such measurement, the better the trend identification accuracy and predictability. The statistical accuracy for the primary, secondary, or even minor trend reversal detection has been been tested to be much higher than any other known technical indicators. It has also been verified that the trend can make a sudden change anytime if the opposite of bull or bear power is strong enough as driven by future, developing, and unexpected events.
The BB-Sigma Index was initially developed as a stock market sentiment measure to validate a new Capital Market Behavior Theory (CMBT) to eliminate the limitation of the conventional Modern Portfolio Theory (MPT). The fundamental difference of CMBT vs. MPT is that the new CMBT quantifies the market behavior by sampling and processing order ticks and volume actions directly with a dual-mode non-symmetric statistical model instead of the oversimplified bell-curve normal distribution assumed by MPT.

|
|
|
|